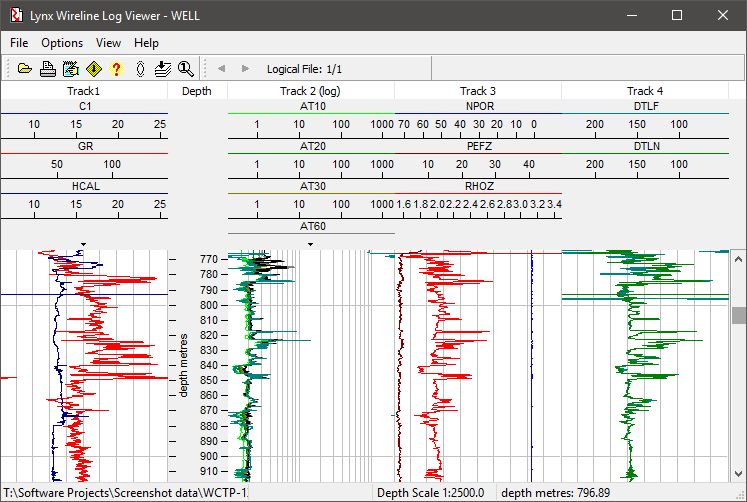
Lynx Logview is a wireline log curve viewer for LAS, LIS and LIS-TIF (LIS Tape Image) formats.Logview displays the curve data in customisable linear or logarithmic tracks.
Logview runs on Microsoft Windows 10, 8, 7, Vista and XP - download a trial version here, and find licensing and pricing information here.
Logview is a standalone utility for viewing wireline log data. Please see here for Lynx Seismap - a wireline log viewer plugin for ESRI ArcMap including formation tops column display.

The all-new Logview version 4 provides extensive improvements in useability:
- Print snapshot or full-scale image, to any windows printer
- Show/hide individual curves
- Quick-switch between two defined curve scales
- Curve scale wrapping
- Warning for undefined curves
- File header display
Logview provides easy adjustments of vertical scale via either the zooming buttons on the toolbar or by setting a scale ratio (such as 1:5000), as well as quick switching between depth units of metres or feet.
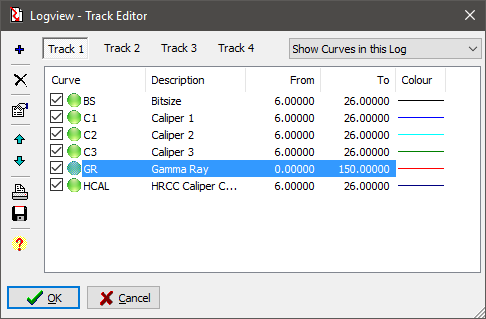
Logview has a comprehensive list of curve descriptions, mnemonics and scale limits which will be used to display log curve data in the conventional multiple track layout, and you can easily add new curve mnemonics to your list, alter default display scale options for each curve, and change the display order of curves in each track.

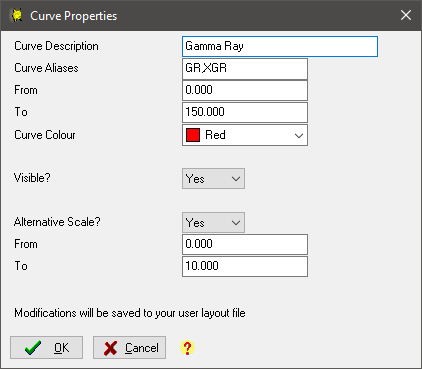
The display properties for each curve can be easily edited.

Logview provides instant access to your curve data, and is a useful data QC tool for checking wireline data before loading curves into a well database.
Download a trial version of Logview here.
