
The Lynx Seismap extension for ESRI's ArcMap application provides integrated seismic, well log and cross-section viewers for ESRI ArcGIS Desktop version 10.8 (including 10.8.1), 10.7, 10.6, 10.5, 10.4, 10.3, 10.2, 10.1 and 10.0 running on Microsoft Windows 10, 8, 7, Vista and XP.
Lynx Seismap features:
- Cross-section viewer - link TIFF, JPEG and PDF images to polylines for scrolling, zooming and panning
- Wireline well log curve display and plot
- Seismic 2D profile display and plot
- UKOOA/SEG-P1 file import for 2D seismic lines, import 2D SEG-Y files
- Seismic 2D basemap shotpoint labelling options
- Seismic 3D inline and crossline display and plot
- Import 3D SEG-Y files, read coordinates from trace headers to generate survey outlines
- Horizon and fault polyline and surface (grid) overlays on 2D and 3D seismic profiles
- Z-Map grid import and export
- Horizon polyline Z-value display by colour ramp
- Horizon/Fault import and export of polyline-Z features
- Formation tops column display with wireline data
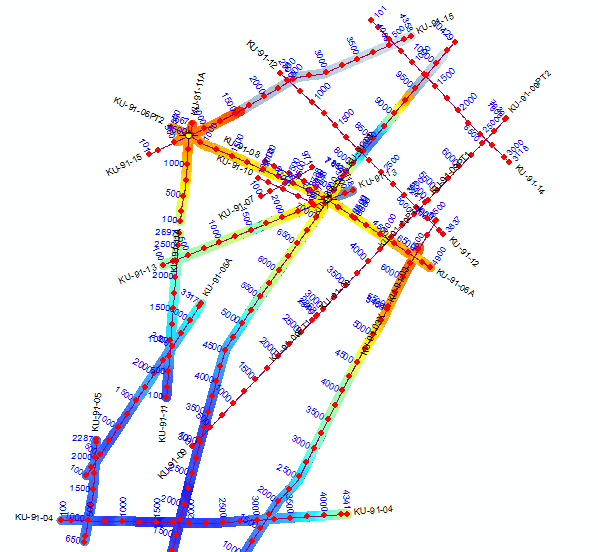
Seismic (2D) profiles and cross-sections are viewed by selecting a line, and well log curve displays are viewed by selecting a well point (surface location) within ArcMap. 3D seismic inlines and crosslines can also be displayed by selecting within a 3D seismic survey polygon. Each seismic profile or well log is displayed in a separate window, and multiple seismic profiles and well logs can be viewed in independent windows. For seismic data and cross sections, the current visible shotpoint/CDP range is displayed and tracked on the map. Horizons and faults (raster grid/tin surfaces and polyline-Z features) and formation tops (from a related table in a geodatabase) can be overlaid on the seismic and wireline viewer displays. As with the Lynx standalone viewers Seisview and Logview, the viewers allow extensive control over the display scales and zooming, with many different display options (see screenshots below for examples), as well as printing to full-scale Windows-compatible plotters.
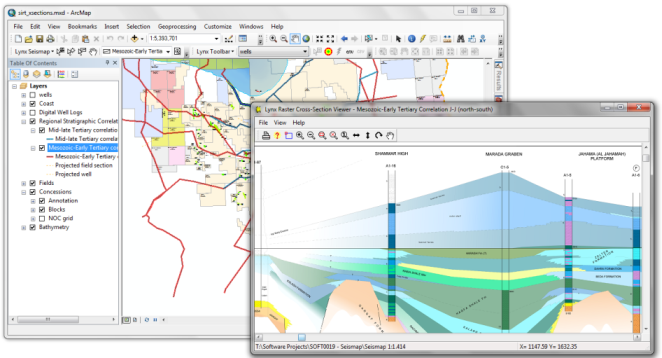
The image above shows a cross-section viewer launched from ArcMap, with the current cross-section range highlighted in the map view. This highlighted range can be grabbed and panned using the hand tool on the Lynx Seismap toolbar.
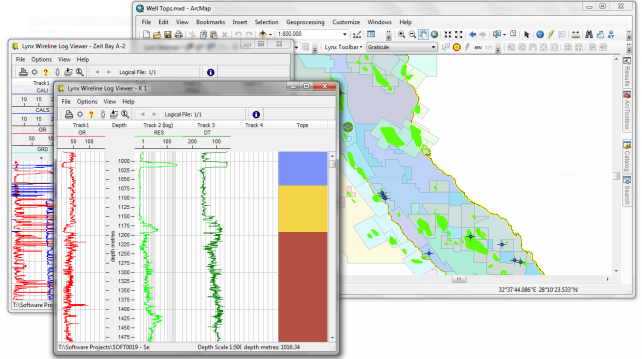
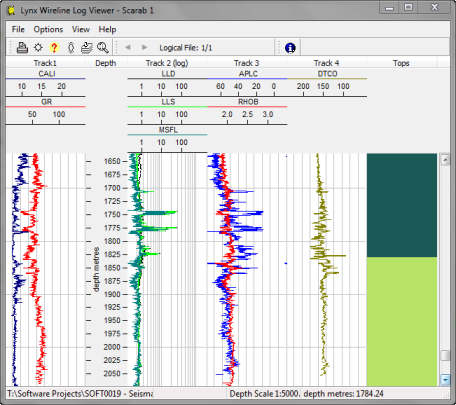
The image above shows well log viewers with a formation tops column read from a geodatabase.
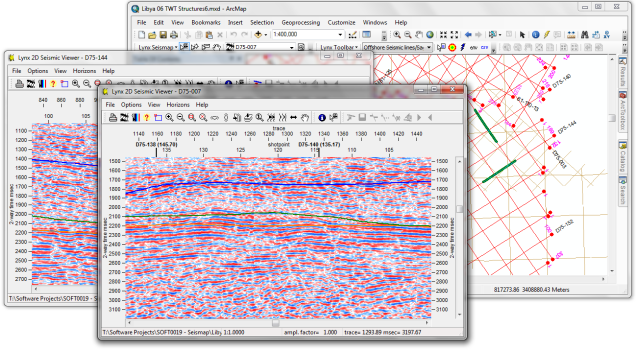
The image above shows a 2D seismic basemap in ArcMap's main window, and two seismic viewer windows displaying 2D profiles in colour display mode.
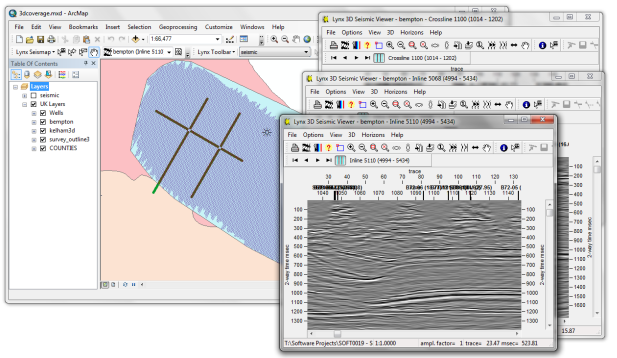
The image above shows a 3D seismic survey polygon (superimposed with live traces) in the main ArcMap window, with seismic viewer windows showing two inlines and one crossline in greyscale display mode.
The prerequisites for Seismap are similar to those required for standard ArcMap field-based hyperlinks.
For 2D seismic data, Seismap requires a polyline-M feature class or route event (which can be a shapefile, geodatabase or SDE layer) containing the seismic locations: each seismic profile should be a separate feature, with shotpoints stored as the measure values. The attribute table must include a field which contains the file-path targets for the seismic data. The seismic files can be either standard SEG-Y or Lynx TR-files.
For 3D seismic data, Seismap requires a feature class containing a polygon outline of each 3D survey, with inline and crossline numbers stored for each vertex as ID/M or Z/M values respectively. As with 2D data, the attribute table should include a field which contains the file-path target for each feature (ie survey). The seismic data for each survey should be stored in a single SEG-Y file per survey, sequential inlines stored end-to-end, with ascending crossline numbers for each inline. It is not necessary to pad all inlines to the same number of traces. Inline and crossline numbers should be stored in the trace headers of the SEG-Y data (header locations are configurable within Seismap). Lynx provides tools, utilities and integrated wizards to read coordinates from trace headers and create the required polygon feature classes.
For well log data, Seismap requires a point feature class containing well surface locations. the attribute table must include a field which contains the file-path targets for the wireline well log data, in either LAS or LIS format.
For cross sections, Seismap requires a polyline feature class. The attribute table must include a field which contains the file-path targets for the cross-sections. The cross-sections must be in a supported file format - at present this includes TIFF, JPEG, RLC or PDF. Seismap assumes that the orientation of the raster cross-section file matches the direction (order of coordinates) of its associated polyline feature - if this is not the case, then the cross-section viewer allows images to be rotated and flipped to correspond to the map view.
Seismap adds property pages into ArcMap's standard Layer Properties dialog, enabling the viewer functionality for supported layer types.
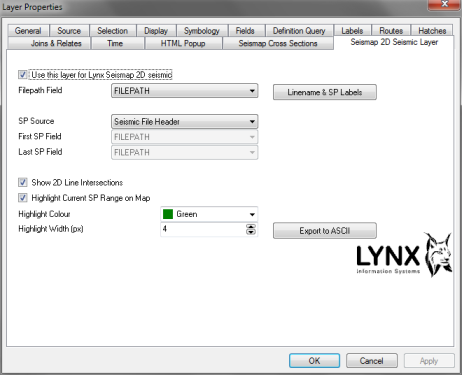 Seismic 2D seismic layer properties.
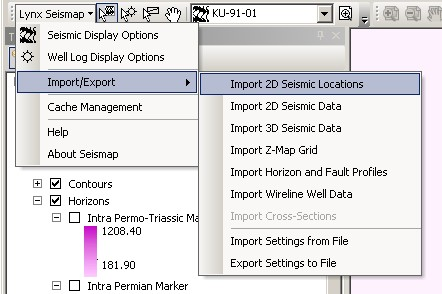
Seismap adds a toolbar to ArcMap, with individual selection tools for seismic, wireline and cross-section features, as well as import tools.
Horizon and fault polylines and surfaces can be displayed as overlays on your seismic profiles. Surfaces can be stored as either ESRI raster grid files or as TINs (display of TIN surfaces requires an ESRI 3D Analyst extension license).
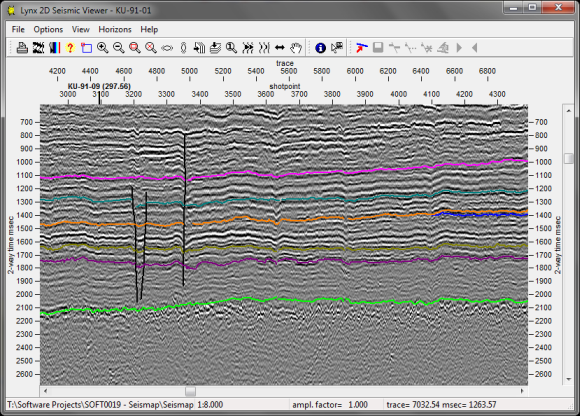
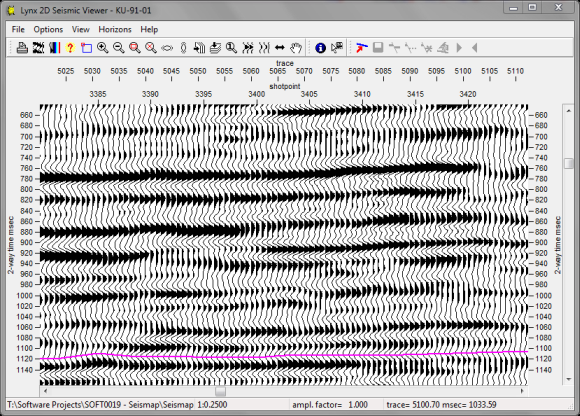
The images above show examples of a seismic profile displayed in greyscale mode and VA/Wiggle mode, with line intersections shown in the shotpoint scalebar and horizon overlays.
Import and export of ZMAP grids (ZMap ASCII grid files) allows interchange of data with many common geophysical software packages. For example, you could import gridded horizons or reservoir models. Imported grids are saved as ESRI raster grids. Seismap will correctly handle input Z-Map grids with rectangular sample grid cells, and interpolate an output raster grid with square sample cells, to avoid distortion of the surface.
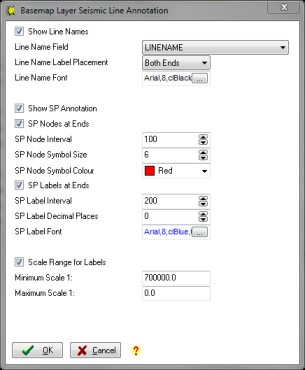
Seismap provides an alternative interface to ArcMap's labelling options, for quick and easy creation of seismic basemaps. You can easily set correctly oriented line names and shotpoint number labels using a simplified subset of the wide range of options available in ArcMap.
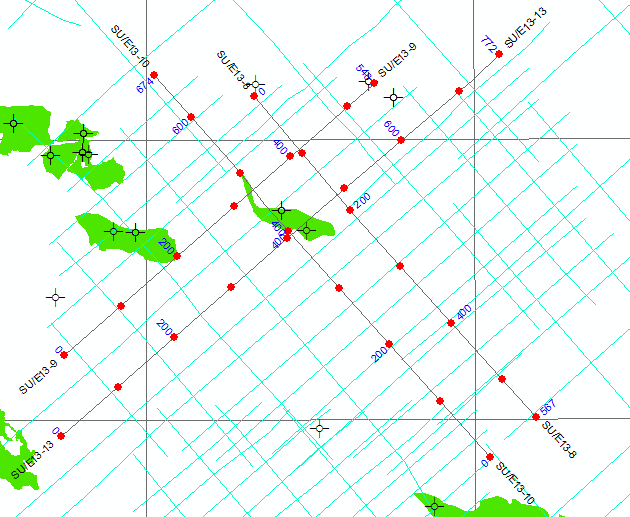
The labelling options are displayed in a dialogue which summarises and simplifies the ArcMap labelling and hatching options.
Seismap provides import and export utilities to convert between UKOOA-style (and SEG-P1) or CSV files and feature classes.
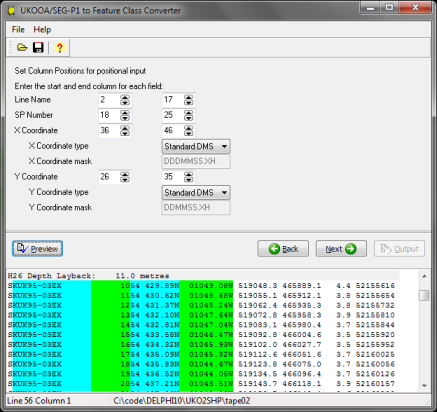
The image above shows the import of a UKOOA file. You can customise the column layout and coordinate format used in the input file to read most common variations on the UKOOA and SEG-P1 specifications. You can also import CSV files containing shotpoint coordinates. The wizard will create a shapefile which will be added directly to your ArcMap project.
Lynx Seismap can also import picked horizon and fault data to polyline-XYZ feature layers. These layers can be overlaid on seismic data (see above) and displayed by their Z-values in arcmap using a custom feature renderer designed specifically for horizon polylines:
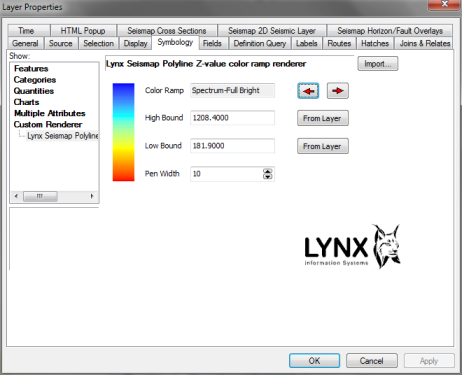
Choose the colour ramp to symbolise the horizon Z values.
Seismap's integrated wireline curve viewer supports the following features:
- Print snapshot or full-scale image, to any windows printer
- Show/hide individual curves
- Quick-switch between two defined curve scales
- Curve scale wrapping
- Formation tops column read from related table
- Warning for undefined curves
- File header display
Download a trial version of Seismap and a sample ArcMap project containing 2D seismic data here, or contact us for more information.
ArcMap® and ArcGIS® are registered trademarks of ESRI Inc.